River Dart Water Quality testing programme
Friends of the Dart is a not for profit Community-Interest Company (CIC) Representing the interests of the River through science, advocacy, and collaboration.
Why do we test the water?
Water quality monitoring enables understanding of pollutants in our River and where they are coming from. This guides our campaigning efforts creating accountability and transparency.
Since launching in 2022, Friends of the Dart has driven significant change.
Phase 1 2022/ 23
FOD volunteers conducted weekly lab tests at 7 sites, this was funded and supported by Surfers against sewage.
We submitted Bathing Water applications for four sites along the River Dart - all of which were granted by DEFRA, meaning it is now the Environment Agency’s responsibility to conduct extensive bacterial monitoring at these sites during the bathing season and investigate sites that are classified as “Poor”. These sites are Steamer Quay in Totnes, Stoke Gabriel, Dittisham, and Warfleet Creek in Dartmouth. Find out more about the use of this lever and what it means to have Designated Bathing Sites here.
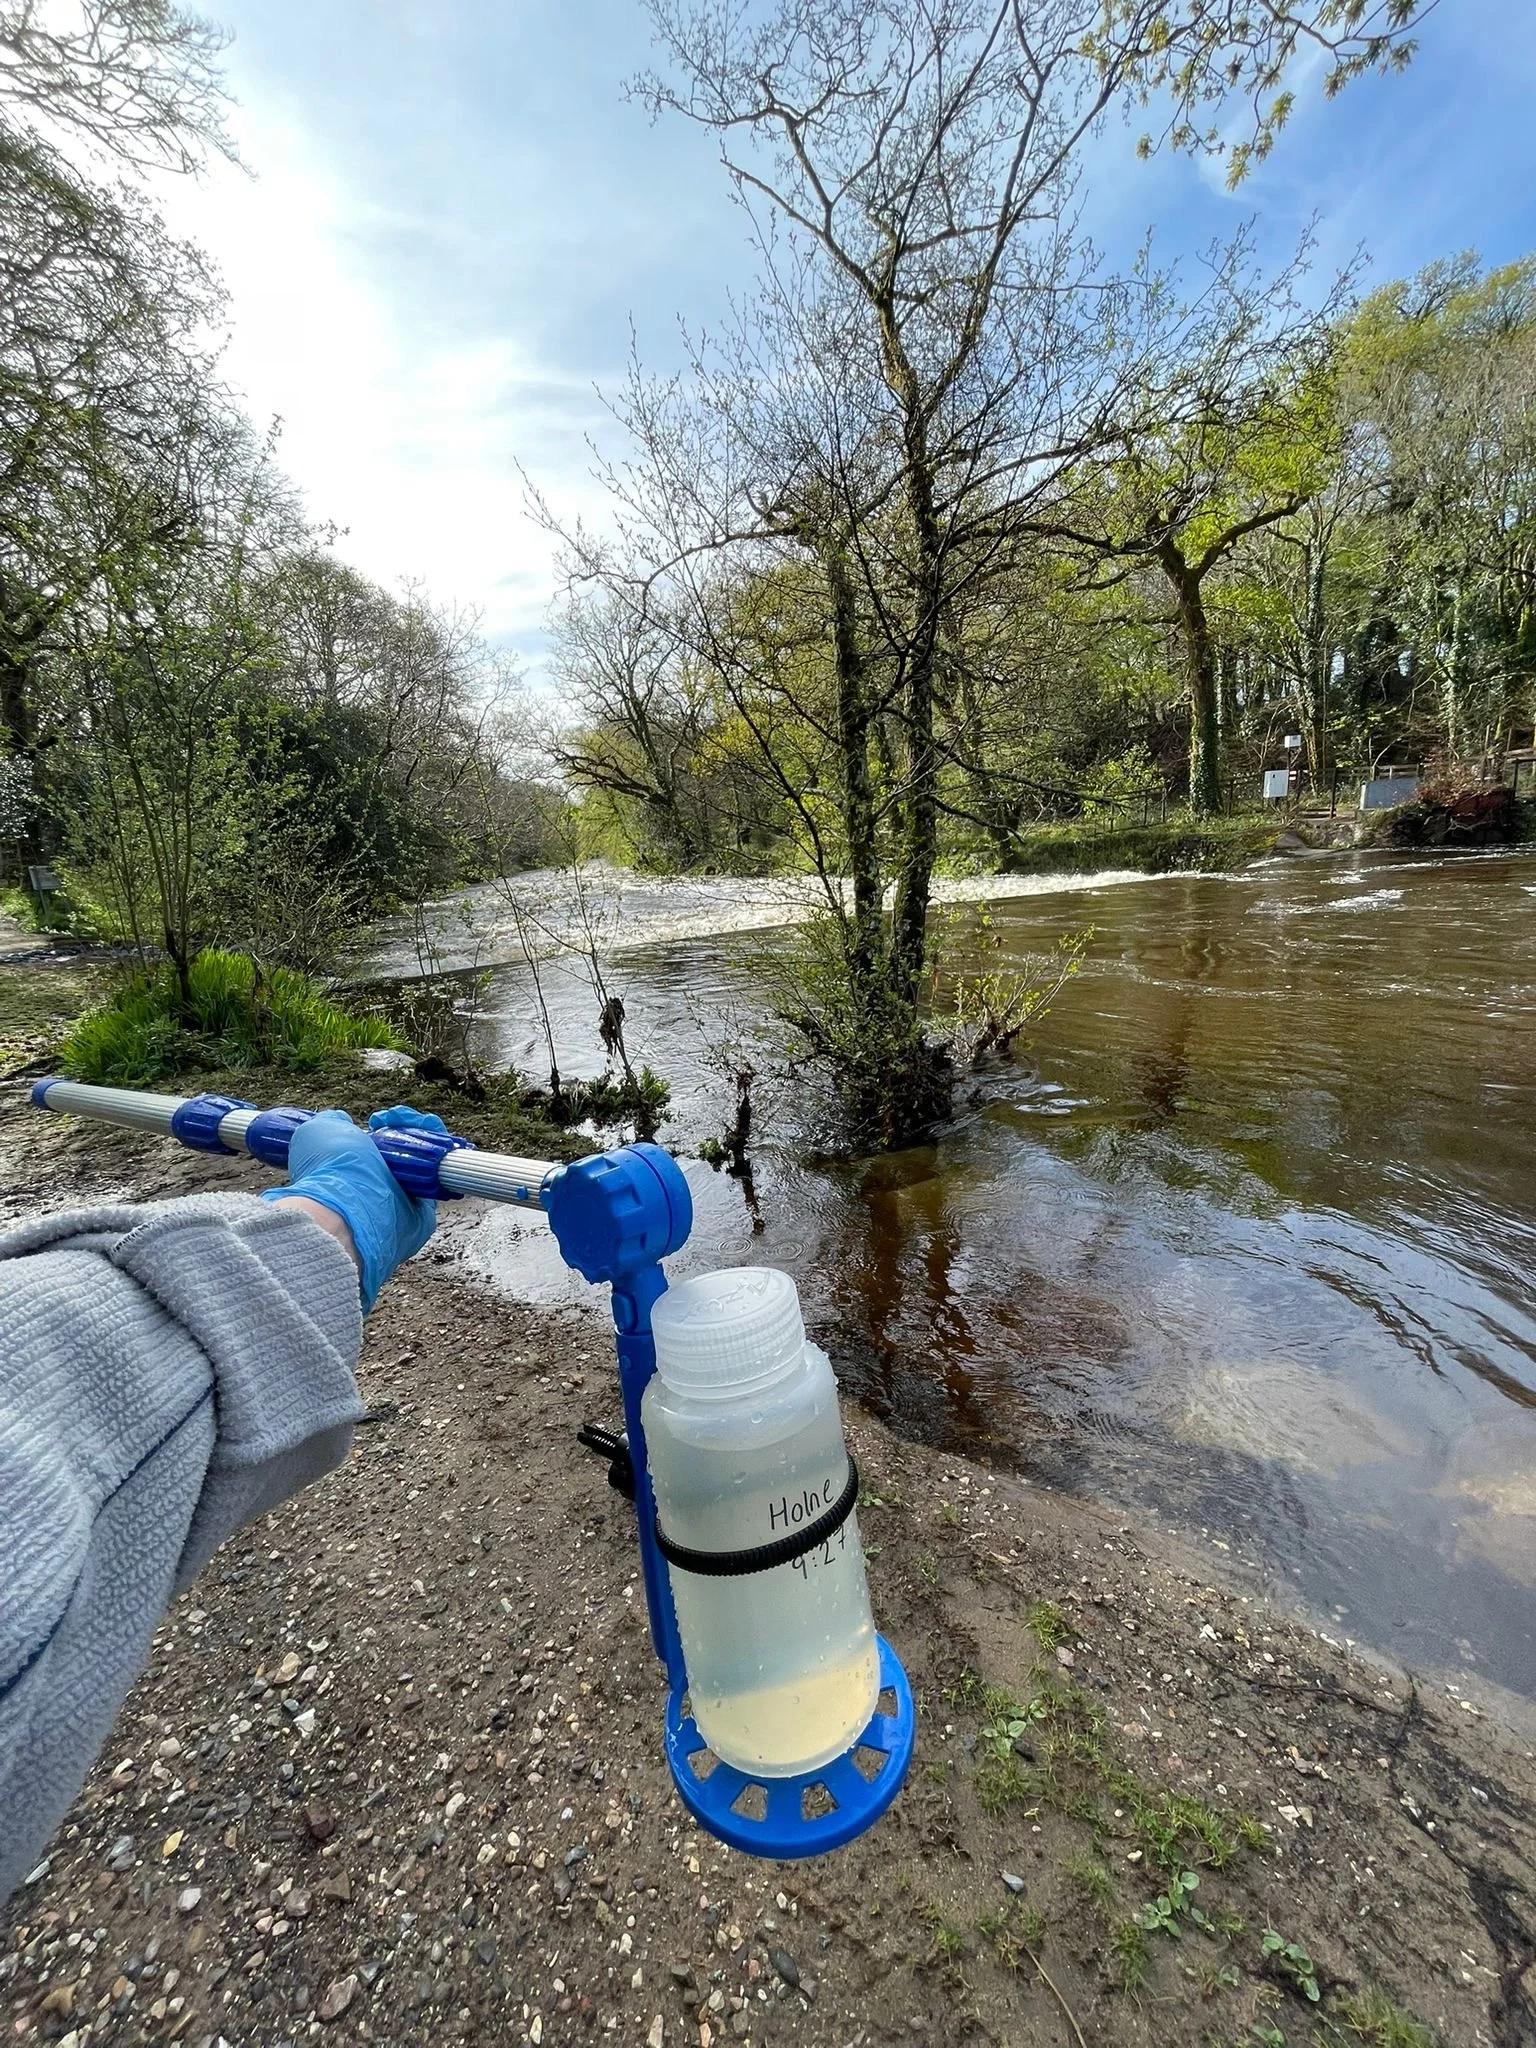
Phase 2 of our work involved collecting weekly samples from the four Designated Bathing Sites and three Community-Designated Sites (Holne Weir, Dartington Beach, and Dartington Pontoon), which were analysed in an accredited laboratory for E. coli and Intestinal Enterococci - key faecal indicator species. In places we tested genetic material to investigate the source. This data helped us understand the levels of bacteria in the River and patterns of pollution throughout the year. The regulatory requirement is to bring all Bathing Water Sites to sufficient standard within 5 years. This has meant that infrastructure updates are now agreed at 16 sites on the Dart catchment. In addition this now includes the updating of capacity and installation of a UV-filter at Kilbury Sewage Treatment Works in Buckfastleigh. See our review of Phase 2 results here.
During Phase 2, we also partnered with the University of York to conduct Watershed testing. Samples collected from the 4 Designated Bathing Sites were analysed for pharmaceuticals, PFAs, PAHs, heavy metals, pesticides, nutrients, and antimicrobial resistance genes. For the summary of these results, please click here.
Phase 3 Monitoring
In 2025, we entered Phase 3 of our water quality monitoring programme. This phase builds on the work we began in 2024 and continues our commitment to sharing open source, reliable information with the local community, businesses, and partners. We aim to investigate faecal pollution sources, with a particular focus on the Dart’s tributaries, to better understand where bacteria levels are elevated and why. This work is carried out in collaboration with partners including the Environment Agency, University of Plymouth, and the Bidwell Brook Partnership.
By collecting two samples per month at each of our 31 sites across the Dart catchment, under both wet and dry weather conditions, and analysing them for E. coli, we hope to answer the following questions:
Where in the Dart catchment are pollution levels highest?
Do certain tributaries contribute more to bacterial loads in the main River?
How do rainfall events affect pollution levels across the sites?
Is there evidence of continuous pollution sources, such as sewage treatment works or agricultural runoff, contributing to water quality issues?
Phase 3 Monitoring Methods
We test for Escherichia coli, a common faecal indicator organism. E. coli lives in the intestines of warm-blooded animals, including humans, and is shed in faeces. Its presence in river water indicates recent contamination by faecal matter, which can carry harmful pathogens that pose risks to both human and environmental health.
We use Neogen Petrifilm™ E. coli Count Plates to test for Escherichia coli, a reliable indicator of faecal contamination from sewage or livestock. If present, E. coli produces a blue colony on the film, which we count to estimate concentration in colony forming units per 100ml (cfu/100ml).
Petrifilm plates are ideal for wide-scale environmental monitoring. They don’t require a full laboratory setup, they give results in 24 hours (compared to 48 hours or more for lab tests), and they’re affordable enough to allow frequent, repeated testing. We are therefore able to conduct weekly testing of samples, allowing us to measure E. coli concentrations across the 31 sites under both wet and dry conditions each month, helping build a clearer picture of pollution sources and patterns over time.
Validating Petrifilms
Before incorporating Petrifilm plates into our routine monitoring programme, we conducted a validation study to assess their reliability. This involved comparing E. coli counts generated using Petrifilms with results from an accredited laboratory across a representative set of water samples. The findings supported the use of Petrifilms as a robust tool for identifying pollution patterns in the Dart catchment. You can read the full validation study here.
To ensure the continued reliability of our E. coli data, we now carry out quarterly validation against results from an accredited laboratory.
At each validation point, a subset of water samples is selected from our routine monitoring. These samples are split into two equal portions:
One portion is delivered to an accredited laboratory for quantitative E. coli analysis.
The other portion is processed in-house using Petrifilm plates, following our Standard Operating Procedure (SOP).
Following analysis, the E. coli counts from both methods are compiled and plotted, allowing for direct visual comparison of results. This dual-plotting approach enables us to assess whether the overall pattern of pollution across sites—as indicated by Petrifilm results—matches that of the lab-generated data.
As our primary aim is to track relative E. coli levels across different tributaries and locations in the catchment, our validation focuses on consistency in spatial pollution patterns rather than exact one-to-one numerical agreement. This ensures that the Petrifilm method remains a reliable, cost-effective tool for identifying pollution hotspots and informing catchment-scale decisions.
Link to key documents and resources
We are working on presenting our results in the easiest way possible, please bear with us.
Site Specific results
The table above shows only a snapshot. Click on the links below to view more detailed information on each site.
Further results will be uploaded here. You may also download this presentation for more background.


